Abstract Manufacturing accounts for about one-third of China's fixed asset investment, and its trend is of great significance for judging the trend of China's economy. Since the second half of 2016, the cumulative growth rate of manufacturing investment has seen its first rebound in the past three years, making the market optimistic about the 2017 manufacturing industry picking up...
Manufacturing accounts for about one-third of China's fixed-asset investment, and its direction is important for judging the trend of China's economy. Since the second half of 2016, the cumulative growth rate of manufacturing investment has risen for the first time in the past three years, making the market optimistic about the recovery of 2017 manufacturing industry, and even think that the new round of cycles has started to increase. In summary, the optimism about the manufacturing industry is mainly due to two aspects: First, after more than three years of de-capacity production, or close to production capacity, investment may bottom out; second, manufacturing The inventory cycle may drive a significant rebound in investment. From the perspective of the superposition of the production cycle and the inventory cycle, this paper combs in detail the stages in which the manufacturing industries are in the process of de-capacity and restocking, and then judges how strong the momentum of manufacturing investment recovery in 2017 is.
I. From the perspective of the production cycle, we selected three indicators of industry concentration growth, PPI year-on-year, and fixed asset investment, and comprehensively judged the stage in which 28 manufacturing industries are currently de-capacity. The rationality of selecting these indicators is: 1) Industry concentration growth. The overcapacity of the current round of China's economy is mainly due to the decentralization of production capacity and low efficiency. Therefore, the promotion of de-capacity is largely reflected in the increase in industrial concentration. We measure the concentration of the industry by the “total assets/enterprise quantity†of each industry. From the change of its year-on-year growth rate, we can roughly observe the de-capacity rhythm of each industry. 2) Industry PPI year-on-year. In the current round of industrial product prices, the prices of the upper, middle and lower reaches have risen unevenly. The rise of PPI is mainly concentrated in the upstream, while many middle and downstream industries have risen sharply in upstream prices due to insufficient demand (or relatively large capacity). In the case of the price increase is relatively limited. Therefore, from the relative increase in the industry PPI year-on-year, it can also reflect whether its de-capacity is relatively sufficient. 3) Growth rate of fixed asset investment. This is the most direct indicator of the willingness to expand production in various manufacturing industries.
In view of the changes in PPI, industry concentration and investment growth in various industries, most industries are still in the process of de-capacity (15/28), so the large-scale pattern of manufacturing de-capacity in 2017 will continue. The upstream industry has experienced a sharp rise in prices, and the pace of de-capacity has slowed down (6/28). In addition, the production capacity of a few industries is close to clearing (3/28), which may bring some upside momentum to manufacturing investment.
1) In the upstream petroleum processing, steel, chemical, coal and rubber industries, the recent pace of production capacity has slowed significantly. This is mainly due to the supply contraction and demand stimulus last year, which led to a faster rise in the price of finished products, and the improvement in profits weakened the incentives for enterprises to de-capacity. In 2016, the total profit of the two major de-capacity benchmark industries, steel and coal, increased by 2.20 times and 3.64 times respectively. Under this circumstance, if there is no administrative over-the-counter intervention, the de-capacity will obviously slow down.
2) The midstream industry is generally in the process of de-capacity, and only the “paper and paper products industry†may be close to production capacity. It is worth noting that the general and specialized equipment manufacturing industry is often linked to the discussion of the Jugla cycle in the near future. The Jugla cycle is an investment cycle driven by equipment replacement. If the Jugla cycle bottoms out, it may be the first to show a significant improvement in equipment manufacturing demand. However, from the current situation that both the general-purpose and special-purpose equipment manufacturing industries are still in the process of de-capacity, even if the demand for equipment renewal is significantly increased, the investment in these two industries may be relatively limited. In addition, the paper industry is often used as an argument for “manufacturing de-capacity is coming to an endâ€, but from the combing results, the paper industry is only a case.
3) The differentiation of the downstream industries is more obvious. The de-capacity has not started, the middle and the near completion have existed, but the middle is mostly. It is worth noting that in the automobile manufacturing industry, under the influence of the purchase tax halving policy, China's automobile production and sales reached a record high in 2016, but the improvement in demand did not change the pattern of overcapacity. In 2017, with the reduction of automobile tax incentives and the decline in sales volume, the de-capacity of the automobile industry may further accelerate.
Recently, there is no lack of optimistic view on the manufacturing industry in 2017, and there are two more influential views:
First, it is believed that 2017 may enter the early stage of the Jugla cycle. The Jugla cycle is an economic cycle driven by machine equipment changes, which lasts for 8-10 years. In the past 30 years, there have been significant Jugrah cycles in the domestic investment trends of the United States and Japan. China has also experienced three rounds of the complete Jugrah cycle since 1982. This year, we are in the 7th year of the fourth round of the cycle that began in 2010. Judging from the past experience of the United States, Japan, and China (8-11 years), the rise of the new round of the Jugla cycle will not occur until at least 2018. Moreover, combined with the apparently lower shift of China’s third-round investment cycle and the long-cycle background of the current aging population and the unsustainable rise in international demand, even in the upcoming new round of the Jugla cycle, investment is on the rise. Kinetic energy may be further weakened. Therefore, in 2017, China may still be in the bottoming stage of the Jugla cycle. Even if the new cycle is started, the kinetic energy of investment will be weak.
Second, it is believed that the actual interest rate will fall significantly in 2016, which will reduce the financing cost of enterprises, and the ROE and ROIC will increase, which will have a certain stimulating effect on the recovery of manufacturing investment. This view is based on the PPI year-on-year deflator and the adjustment of the loan interest rate. It is indeed possible to see a sharp decline in the actual loan interest rate of enterprises. However, if the PPI production data is used as a representation of the upstream price and the PPI's subsistence data is used as a representation of the downstream price, it can be seen that in 2016, the actual lending rate of the upstream industry fell by 12.2 percentage points (end of year). Only 1.1%); while the actual lending rate in the downstream industry fell by only 1 percentage point (5% at the end of the year).
In other words, the rising price of the upstream industry does make its financing costs relatively lower, but the downstream industry may not feel the obvious downward cost of financing due to limited price-raising ability. Therefore, I am afraid that we cannot conclude that the financing cost of the enterprise has been lowered, so that the prospect of investment recovery in the middle and downstream industries still needs to be cautiously judged; while the upstream industry still faces a tougher capacity-removal policy, although its actual financing cost is greatly reduced. However, the kinetic energy of investment expansion is also extremely limited.
Second, the inventory cycle perspective The average length of the inventory cycle is 40 months, which is a short cycle. According to the peak of each round of inventory cycle, China has experienced five rounds of inventory cycles since 1996. The length is 40.6 months from 1998-2001, 44.6 months from 2001-2004, 42.7 months from 2004-2008, 38.5 months from 2008-2011, and 34.5 months from 2011-2014. The period length is 40.2 months. At present, China is in the inventory cycle starting in August 2014. Judging from the cumulative year-on-year growth rate of industrial enterprise finished goods inventory and industrial enterprise main business income, the current cycle began to enter the active replenishment stage from June 2016.
The current inventory cycle is superimposed on the de-capacity, which is about a weak cycle. In the above five rounds of inventory cycle, there were three rounds of strong periods, 2001-2004, 2004-2008, 2008-2011; two rounds were weak, 1998-2001, 2011-2014 . It is worth noting that in the strong cycle, 2001-2004 was driven by the factors of trade globalization. In 2004-2008, China's economy as a whole was improving. In 2008-2011, the country launched 4 trillion strong stimulus, and these backgrounds are difficult to reproduce. In the weak cycle, the destocking process was superimposed on the inventory cycles of 1998-2001 and 2011-2014. The rise periods of the two rounds of inventory cycle accounted for only 32% and 35% of the total cycle length, respectively.
Judging from the length of the cycle and the stage judgment, the cycle of replenishing the inventory in the current round of manufacturing has reached the middle and the middle (Figure 1). It is expected that the replenishment process will end in the second half of this year, and the potential for further increase in inventory growth is not strong. As mentioned earlier, the current inventory cycle is due to the background of the superposition of capacity, and the high probability is a weak cycle. In the two rounds of weak periods 1998-2001 and 2011-2014, the active restocking period lasted about 2-3 quarters, and the active restocking phase of the current round is close to three quarters. However, considering that the current round of manufacturing capacity is more adequate than in 2013, the de-construction of production capacity may limit the speed of replenishing stocks. Therefore, it is expected that there will be an active restocking of about one quarter in the future.
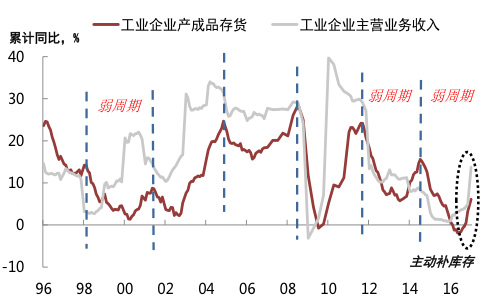
Chart 1: This round of inventory cycle is already in the middle and rear segments
Third, judging that the new cycle has started as a fashion early 2017 manufacturing capacity to continue to expand the pattern will continue. However, the de-capacity caused by the upstream price increase has slowed down, and the production capacity of a few industries has been close to clearing, or the manufacturing investment has rebounded slightly. In the context of de-capacity, the current replenishment cycle of the manufacturing industry has reached the middle and the back stage. The replenishment process will end in the second half of 2017, and the potential for further increase in inventory growth is not strong. Therefore, from the superposition of production capacity and inventory cycle, it is not appropriate to expect too much momentum for the rebound of manufacturing in 2017.
A phenomenon worthy of attention is that the pattern of “stable investment and warm production†may continue in the past year. Since last year, the price of upstream industrial products has risen sharply, but this increase is mainly caused by the partial de-capacity of administrativeization, without the support of too solid and sustainable terminal demand. In this context, companies are more likely to increase capacity utilization at existing capacity, and are less likely to expand capacity on a large scale. This is an important reason for the significant differentiation of manufacturing investment and production indicators last year (Exhibit 2). Since the beginning of 2017, even if the real estate investment in the first half of the year is relatively stable, the enthusiasm for infrastructure investment is high, and the export demand has improved significantly, it seems that it is enough to support the overall demand of the economy to continue to improve. However, in the context that the production capacity will continue to advance, we may only look at it. To the manufacturing enterprises to continue to "sell production by sales" to improve capacity utilization. The real recovery in manufacturing investment requires both decisive progress in capacity and the emergence of new economic growth points. In this way, the confidence of manufacturing enterprises to invest in expansion can be effectively restored.
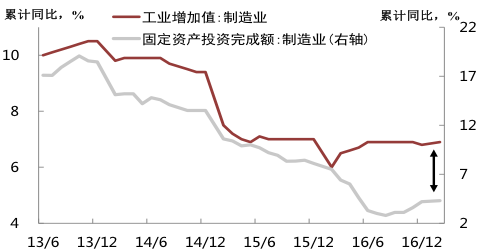
Exhibit 2: Since 2016, the manufacturing industry has shown the characteristics of “investment is cold and production is stableâ€
(Note: This article only represents the author's point of view, Zhong Zhengsheng is the chief economist of Cai Ni Research in Monita, and Zhang Wei is the macro analyst of Caixin Think Tank Monita)
The appearance of minimalist celing lamp has simple and elegant design.
The most important thing is that its lighting effect is very good. The light is soft, far beyond the feeling of its appearance.
Minimalist Ceiling Lamp,Minimalist Ceiling Light,Ceiling Light Fixture,Ceiling Light
JINGYING , https://www.jingyinglight.com